PW-pipeline
PathWay pipeline using GWAS summary statistics, named analogously after FM-pipepline I have implemented.
INTRODUCTION
Pathway analysis becomes an important element in GWAS. Broadly, it involves SNP annotation, such as Variant Effect Predictor (VEP), gene analysis such as VEGAS2, and gene set analysis. Visualisation of a particular region has been facilitated with LocusZoom, while network(s) from pathway analysis via gephi or Cytoscape, which uses genes and a collection of edges, directed or undirected, to build a network. Aspects to consider include part or all databases, individual level genotype data vs GWAS summary statistics, computing speed, with and without tissue enrichment.

INSTALLATION
This pipeline involves several software for pathway analysis using GWAS summary statistics, as shown below,
| Full name | Abbreviation | Reference |
|---|---|---|
| Meta-Analysis Gene-set Enrichment of variaNT Associations | MAGENTA | Segre, et al. (2010) |
| Multi-marker Analysis of GenoMic Annotation | MAGMA | de Leeuw, et al. (2015) |
| PAthway SCoring ALgorithm | PASCAL | Lamparter, et al. (2016) |
| Data-Driven Expression Prioritized Integration for Complex Traits | DEPICT | Pers, et al.(2015) |
The full functionality of the pipeline requires availability of individual software for pathway analysis, whose requirements should be
fulfiled, e.g., Matlab for MAGENTA. For PASCAL, minor changes
need to be made with Pascal in that by default DIR is where it is called so it needs to be changed into PASCAL installation directory
and that instead of the relative path jars/pascalDeployed.jar an absolute prefix should be added. Although PASCAL was designed to handle
LD with many SNPs, it fails to run when very large number of SNPs are involved in which case it would help to shorten the list.
The current version of pipeline also uses DEPICT from the GitHub but with data in the release version from the Broad,
https://data.broadinstitute.org/mpg/depict/. Under Python 2.7.x, amendment needs to be made from sort() to sort_values() in src/python/depict_library.py as described in http://pandas.pydata.org/pandas-docs/stable/generated/pandas.DataFrame.sort_values.html. It may also complain about too few background files in depict/data/backgrounds so it is necessary to remove the relevant directory and have a repetitive run. Finally, it is useful to install
XpdfReader or ImageMagick to produce Excel workbook. Some information on
job scheduling software as with R is given at https://github.com/jinghuazhao/Computational-Statistics.
On systems supporting modules, they can be loaded before hand but it is possible that appropriate module is loaded seamlessly, e.g.,
echo -e "function module (){eval \`/usr/bin/modulecmd bash $*\`}" > matlab
echo module load matlab/r2017b >> matlab
echo matlab \"\$\@\" >> matlab
chmod +x matlab
NB “$@” enables matlab to be called as usual. Alternatively, the module commands can be part of pwp.ini which is sourced with pwp.sh.
The pipeline itself can be installed from GitHub in the usual way.
git clone https://github.com/jinghuazhao/PW-pipeline
USAGE
The pipeline requires users to specify both software and database to be used, which is now through pwp.ini in the working directory.
The syntax is then
bash pwp.sh <input file>
Input
The input will be GWAS summary statistics described at https://github.com/jinghuazhao/SUMSTATS in that order without the header,
Output
The output will be available from individual directories named after the software you choose, and optionally in case all software are used the output can also be an Excel workbook containing combined results.
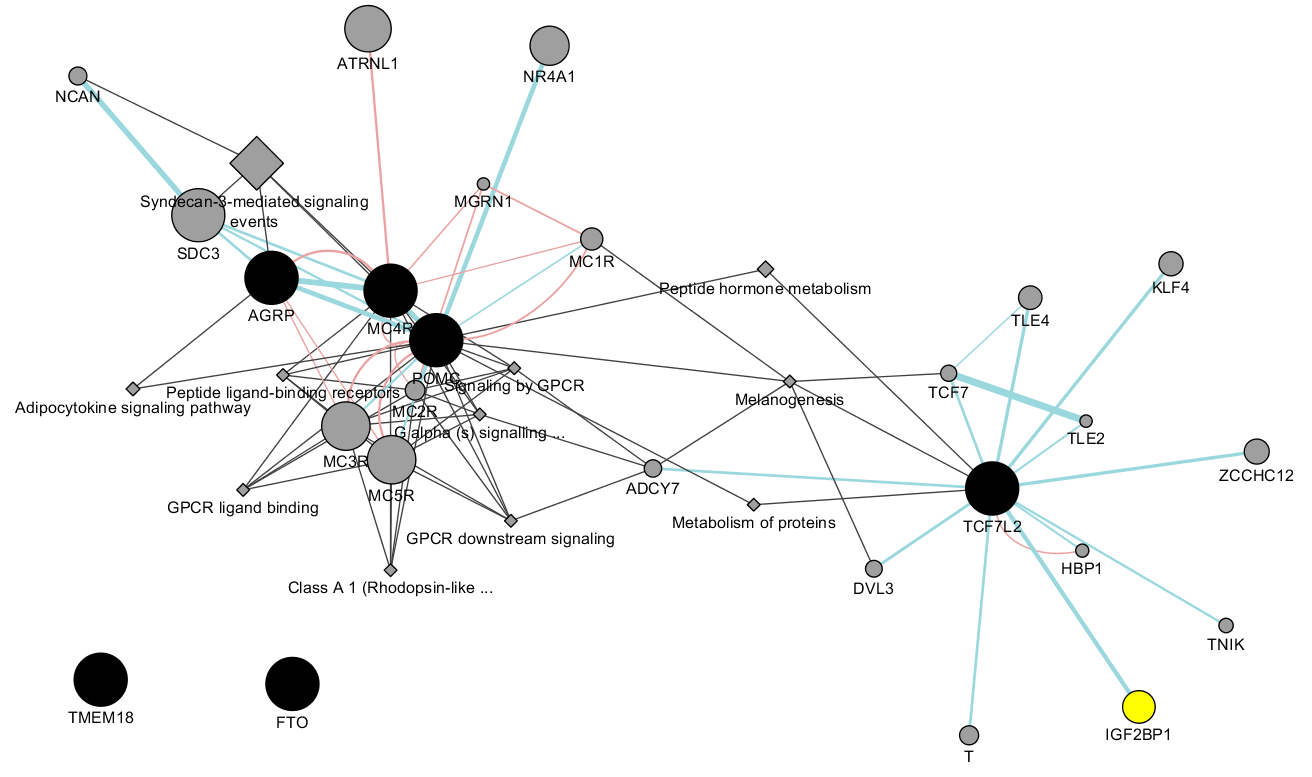
For DEPICT databases, it is possible to call netowrk_plot.py to generate network diagram and perform cluster analysis.
EXAMPLES
The bmi.tsv.gz and ST4 from https://github.com/jinghuazhao/SUMSTATS can be called as follows,
gunzip -c bmi.tsv.gz > BMI
pwp.sh BMI
and
pwp.sh ST4 &
ADDITIONAL TOPICS
The wiki page contains the following information,
You can make changes to the configuration files for each software in their own direcories. See also software-notes on how to set up VEGAS2, as in vegas2v2.sh.
RELATED LINKS
- BioGRID: an interaction repository with data compiled through comprehensive curation efforts.
- Osprey: Network Visualization System.
- GeneMANIA: Imports interaction networks from public databases from a list of genes with their annotations and putative functions.
- rGREAT: Client for GREAT Analysis
- VisANT: Visual analyses of metabolic networks in cells and ecosystems.
ACKNOWLEDGEMENTS
The work drives from comparison of software performances using our own GWAS data. The practicality of a common DEPICT database to all software here was due to PASCAL developer(s). At the end of our implementation it came to our attention that similar effort has been made, e.g., DEPICT-pipeline and other adaptations.
SOFTWARE AND REFERENCES
Pers TH et al.(2015) Biological interpretation of genome-wide association studies using predicted gene functions. Nat Commun 6:5890. doi: 10.1038/ncomms6890.
Segre AV, et al (2010). Common inherited variation in mitochondrial genes is not enriched for associations with type 2 diabetes or related glycemic traits. PLoS Genet 12;6(8). pii: e1001058. doi: 10.1371/journal.pgen.1001058
de Leeuw C, et al. (2015) MAGMA: Generalized gene-set analysis of GWAS data. PLoS Comput Biol 11(4): e1004219. doi: 10.1371/journal.pcbi.1004219
Lamparter D, et al. (2016) Fast and rigorous computation of gene and pathway scores from SNP-based summary statistics. PLoS Comput Biol 12(1):e1004714. doi: 10.1371/journal.pcbi.1004714
VEGAS2 (Versatile Gene-based Association Study)
Liu JZ, et al. (2010). A versatile gene-based test for genome-wide association studies. Am J Hum Genet 87:139–145.