This article collects notes on peptide/protein analysis, especially with respect to spectrum data.
pkgs <- c("Biostrings", "CAMERA", "MSnbase", "MSstats", "Spectra", "mzR", "protViz", "rawrr")
for (p in pkgs) if (length(grep(paste("^package:", p, "$", sep=""), search())) == 0) {
    if (!requireNamespace(p)) warning(paste0("This vignette needs package `", p, "'; please install"))
}
invisible(suppressMessages(lapply(pkgs, require, character.only = TRUE)))
1 Peptide sequence
Here is an example for PROC_HUMAN, which is handled by the Biostrings package,
fasta_file_path <- 'https://rest.uniprot.org/uniprotkb/P04070.fasta'
fasta_sequences <- Biostrings::readAAStringSet(fasta_file_path, format = "fasta")
AA_sequence <- fasta_sequences[[1]]
cat("Sequence:", toString(AA_sequence), "\n")
iso_442688365 <- 'TDGEGALSEPSATVTIEELAAPPPPVLMHHGESSQVLHPGNK'
match_position <- regexpr(iso_442688365, AA_sequence)
match_position
mp <- matchPattern(iso_442688365,AA_sequence)
mp
load("~/pQTLtools/tests/PROC.rda")
pQTLtools::peptideAssociationPlot(protein,cistrans)
#> Joining with `by = join_by(Modified.Peptide.Sequence)`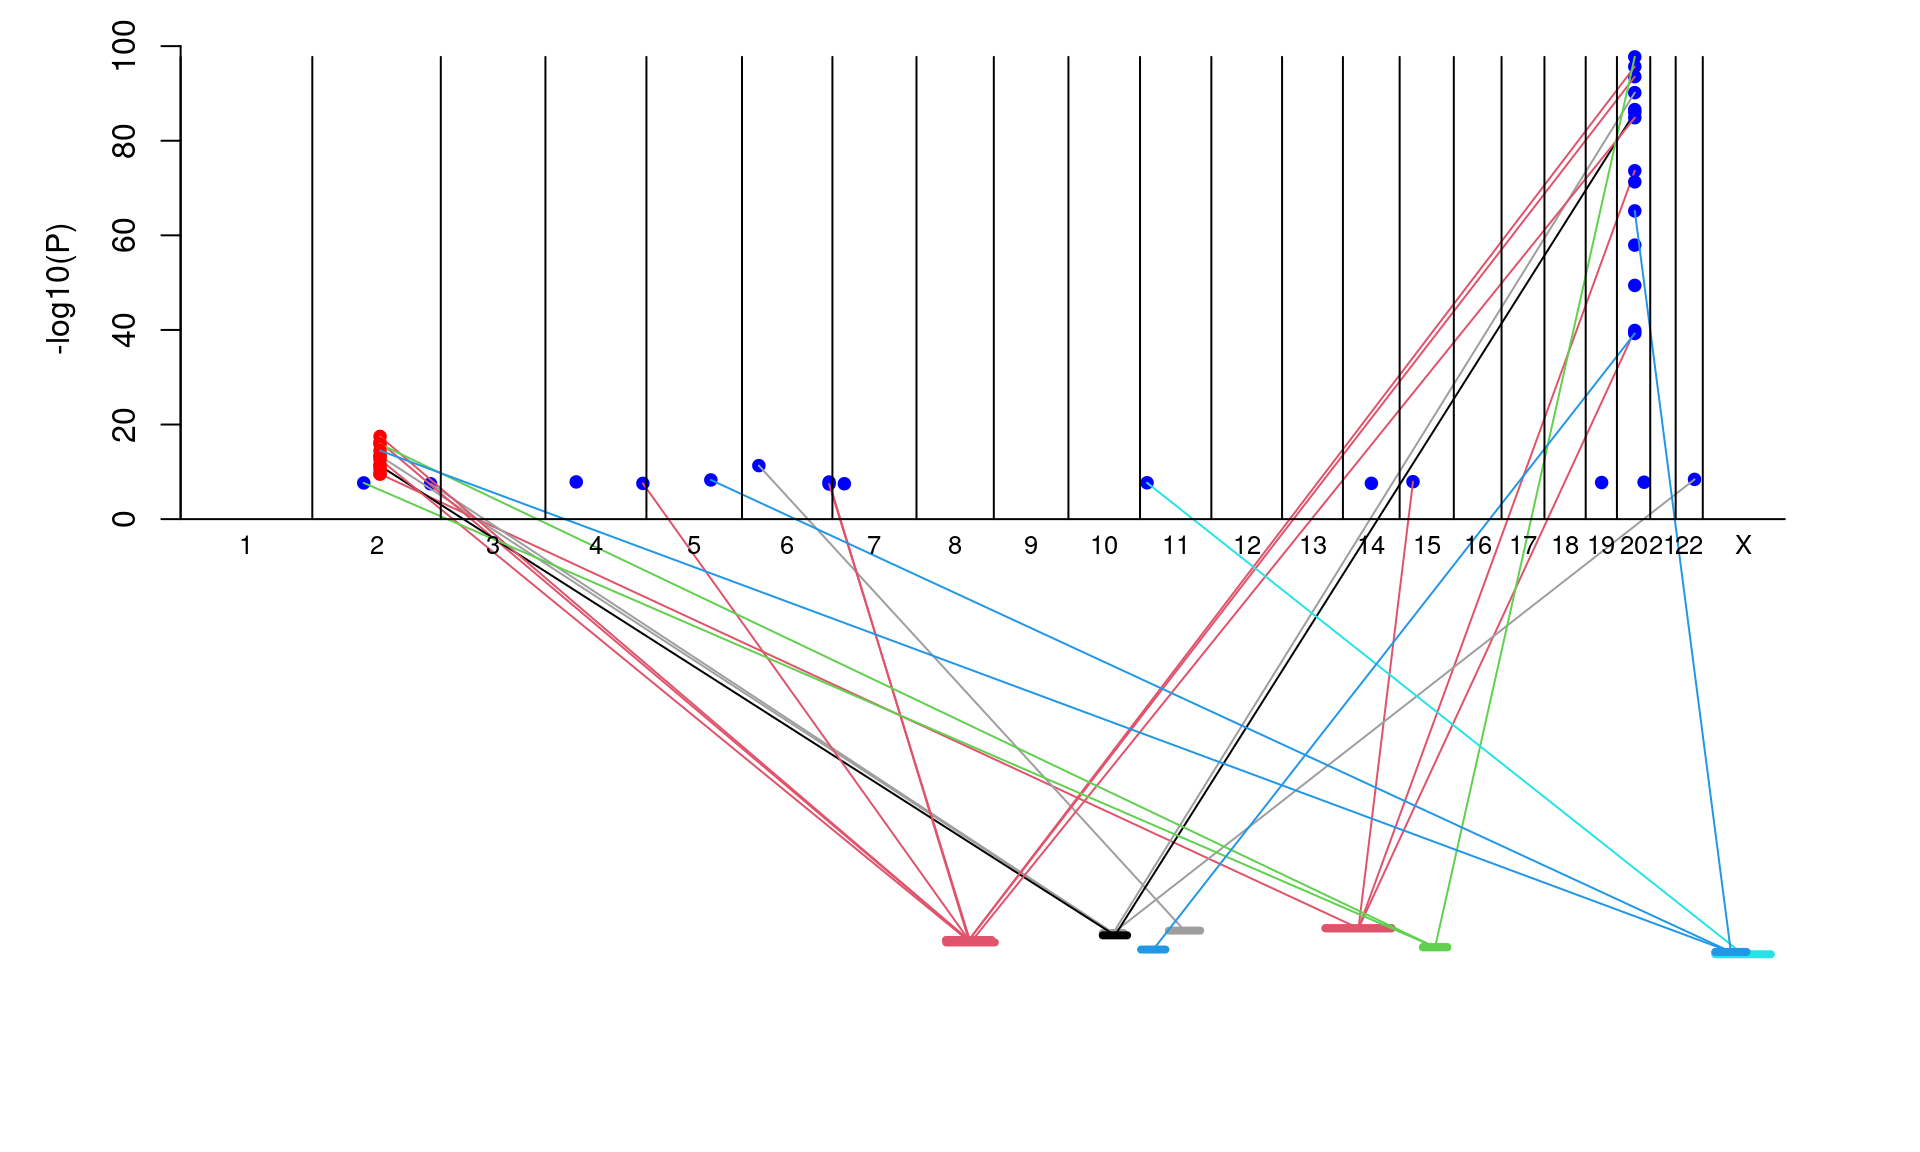
Figure 1.1: peptide association plot
2 Spectrum data analysis
2.1 Setup
The .raw files can be handled by rawrr package nevertheless it requires necessary files,
library(rawrr)
if (isFALSE(rawrr::.checkDllInMonoPath())){
   rawrr::installRawFileReaderDLLs()
}
if (isFALSE(file.exists(rawrr:::.rawrrAssembly()))){
   rawrr::installRawrrExe()
}
2.2 List of.raw files
Based on a real project, the following is an example of listing/generating multiple .raw from .zip files
# ZWK .raw data
spectra_ZWK <- "~/Caprion/pre_qc_data/spectral_library_ZWK"
raw_files <- list.files(spectra_ZWK, pattern = "\\.raw$", full.names = TRUE)
## collectively
suppressMessages(library(MsBackendRawFileReader))
ZWK <- Spectra::backendInitialize(MsBackendRawFileReader::MsBackendRawFileReader(),
       files = raw_files)
class(ZWK)
methods(class=class(ZWK))
Spectra(ZWK)
spectraData(ZWK)
ZWK
ZWKvars <- ZWK |> Spectra::spectraVariables()
ZWKdata <- ZWK |> Spectra::spectraData()
dim(ZWKdata)
# rows with >=1 non-NA value in the columns with prefix "precursor"
precursor <- apply(ZWKdata[grep("precursor",ZWKvars)], 1, function(x) any(!is.na(x)))
ZWKdata_filtered <- ZWKdata[precursor, ]
save(ZWK,file="~/Caprion/analysis/work/ZWK.rda")

# ZYQ/UDP
library(utils)
spectra <- "~/Caprion/pre_qc_data/spectra"
zip_files <- dir(spectra, recursive = TRUE, full.names=TRUE)
work_dir <- "~/Caprion/analysis/work"
for (zip_file in zip_files) unzip(zip_file, exdir=work_dir)
ZYQ_UDP <- Spectra::backendInitialize(MsBackendRawFileReader::MsBackendRawFileReader(),
           files = dir(work_dir,patt="raw",full.names=TRUE))
class(ZYQ_UDP)
ZYQ_UDP
ZYQ_UDP |> Spectra::spectraVariables()
save(ZYQ_UDP,file="~/Caprion/analysis/work/ZYQ_UDP.rda")
2.3 Usage
Various facilities are shown below.
options(width=200)

# various files
d <- "/rds/project/rds-zuZwCZMsS0w/Caprion_proteomics/analysis/crux"
f <- file.path(d,"szwk901104i19801xms1.mzML")
x <- file.path(d,"szwk901104i19801xms1.mzXML")
g <- file.path(d,"szwk901104i19801xms1.mgf")
r <- file.path(d,"szwk901104i19801xms1.rda")
z <- file.path(d,"szwk901104i19801xms1.mzML.gz")

# mzML
mz <- mzR::openMSfile(f)
header_info <- mzR::header(mz)
table(header_info$msLevel)
peak_data <- mzR::peaks(mz)
spec <- mzR::spectra(mz)
class(spec)
length(spec)
lapply(spec,head,3)
methods(class="mzRpwiz")
mzR::close(mz)

mz <- mzR::openMSfile(z, backend = "pwiz")
mz
nChrom(mz)
head(tic(mz))
head(chromatogram(mz, 1L)) ## same as tic(x)
str(chromatogram(mz))
head(peaks(mz, scan=4))

# MSnbase
mzXML <- MSnbase::readMSData(x)
mgf <- MSnbase::readMgfData(g)
save(mzXML,mgf,file=r)

MSnbase::extractSpectraData(mzXML)
MSnbase::hasSpectra(z)
MSnbase::hasChromatograms(z)
MSnbase::plot2d(mzXML,z="peaks.count")
MSnbase::plotDensity(mzXML,z="precursor.mz")

MSnbase::extractSpectraData(mgf)
methods(class="MSpectra")
MSnbase::mz(mgf)
MSnbase::intensity(mgf)
MSnbase::rtime(mgf)
MSnbase::precursorMz(mgf)
MSnbase::precursorCharge(mgf)
MSnbase::precScanNum(mgf)
MSnbase::precursorIntensity(mgf)
MSnbase::acquisitionNum(mgf)
MSnbase::scanIndex(mgf)
MSnbase::peaksCount(mgf)
MSnbase::msLevel(mgf)
MSnbase::tic(mgf)
MSnbase::ionCount(mgf)
MSnbase::collisionEnergy(mgf)
MSnbase::fromFile(mgf)
MSnbase::polarity(mgf)
MSnbase::smoothed(mgf)
MSnbase::centroided(mgf)
MSnbase::isCentroided(mgf)
MSnbase::writeMgfData(mgf, con = "spectra.mgf", COM = NULL, TITLE = NULL)
MSnbase::removePeaks(mgf, t, msLevel., ...)
MSnbase::filterMsLevel(mgf, msLevel=2)
MSnbase::as.ExpressionSet(mgf)

# This turned to be really slow!
sp_list <- lapply(seq_along(mgf), function(i) {
  intensity_i <- MSnbase::intensity(mgf)[[i]]
  mz_i <- MSnbase::mz(mgf)[[i]]
  centroided_i <- MSnbase::centroided(mgf)[[i]]
  return(new("Spectrum1", intensity = intensity_i, mz = mz_i, centroided = centroided_i))
})
sp1 <- do.call(rbind, sp_list)
# only the first one is more manageable
sp1 <- new("Spectrum1",intensity=MSnbase::intensity(mgf)[[1]],mz=MSnbase::mz(mgf)[[1]],centroided=MSnbase::centroided(mgf)[[1]])
sp2 <- MSnbase::pickPeaks(sp1)
MSnbase::intensity(sp2)
plot(MSnbase::mz(sp1),MSnbase::intensity(sp1),type="h")
## Without m/z refinement
points(MSnbase::mz(sp2), MSnbase::intensity(sp2), col = "darkgrey")
## Using k = 1, closest signals
sp3 <- MSnbase::pickPeaks(sp1, refineMz = "kNeighbors", k = 1)
points(MSnbase::mz(sp3), MSnbase::intensity(sp3), col = "green", type = "h")
## Using descendPeak requiring at least 50% or the centroid's intensity
sp4 <- MSnbase::pickPeaks(sp1, refineMz = "descendPeak", signalPercentage = 50)
points(MSnbase::mz(sp4), MSnbase::intensity(sp4), col = "red", type = "h")

# CAMERA
xs   <- CAMERA::xcmsSet(f, method="centWave", ppm=30, peakwidth=c(5,10))
an   <- CAMERA::xsAnnotate(xs)
an   <- CAMERA::groupFWHM(an)
#For one group
peaklist <- CAMERA::getpspectra(an, 1)
#For two groups
peaklist <- CAMERA::getpspectra(an, c(1,2))

# Spectra
suppressMessages(library(Spectra))
sp <- Spectra::Spectra(z)
head(sp)
table(sp$msLevel)
d <- Spectra::computeMzDeltas(sp[1:1000])
Spectra::plotMzDelta(d)

# protViz
protViz::fragmentIon("TFVLNFIK")
esd <- MSnbase::extractSpectraData(mgf)
op <- par(mfrow=c(2,1))
ms <- function(i) with(esd[i,],list(title=TITLE,rtinseconds=RTINSECONDS,pepmass=PEPMASS,charge=CHARGE,
                                    mZ=MSnbase::mz(mgf[[i]]),intensity=MSnbase::intensity(mgf[[i]])))
protViz::peakplot("TAFDEAIAELDTLNEESYK", ms(1))
protViz::peakplot("TAFDEAIAELDTLSEESYK", ms(2))
par(op)
load("~/Caprion/pilot/ZWK.rda")
peptides <- subset(mapping_ZWK,Protein=="PROC_HUMAN")[["Modified.Peptide.Sequence"]] |> unique()
pim <- protViz::parentIonMass(peptides)
fi <- protViz::fragmentIon(peptides)
df <- as.data.frame(fi)
op <- par(mfrow=c(3,1))
for (i in 1:length(peptides)){
    plot(0, 0,
    xlab='m/Z',
    ylab='',
    xlim=range(c(fi[[i]]$b,fi[[i]]$y)),
    ylim=c(0,1),
    type='n',
    axes=FALSE,
    sub=paste(peptides[i], "/", pim[i], "Da"));
    box()
    axis(1, fi[[i]]$b, round(fi[[i]]$b,1), las=2)
    axis(1, fi[[i]]$y, round(fi[[i]]$y,1), las=2)

    pepSeq<-strsplit(peptides[i], "")
    axis(3,fi[[i]]$b, paste("b", row.names(fi[[i]]),sep=''),las=2)
    axis(3,fi[[i]]$y, paste("y", row.names(fi[[i]]),sep=''),las=2)

    text(fi[[i]]$b, rep(0.3, nchar(peptides[i])),
    pepSeq[[1]],pos=3,cex=4, lwd=4, col="#aaaaaaaa")

    abline(v=fi[[i]]$b, col='red')
    abline(v=fi[[i]]$y, col='blue',lwd=2)
}
par(op)

# MSstats
head(SRMRawData)
QuantData <- MSstats::dataProcess(SRMRawData, use_log_file = FALSE)
quant <- MSstats::dataProcess(SRMRawData,
                              normalization = "equalizeMedians",
                              summaryMethod = "TMP",
                              censoredInt = "NA",
                              MBimpute = TRUE,
                              maxQuantileforCensored = 0.999,
                              logTrans=2,
                              use_log_file=FALSE,
                              numberOfCores=5)
names(quant)MSstats1 takes output from other data-processing pipelines.
3 Bioconductor/CRAN packages
| Package | Description |
|---|---|
| Bioconductor | |
| Biostrings | Efficient manipulation of biological strings |
| CAMERA | Collection of annotation related methods |
| MSnbase | Base Functions and Classes for Mass Spectrometry and Proteomics |
| MSstats | Protein Significance Analysis in DDA, SRM and DIA Proteomics |
| Spectra | Spectra Infrastructure for Mass Spectrometry |
| mzR | parser for netCDF, mzXML and mzML and mzIdentML files |
| rawrr | Direct Access to Orbitrap Data and Beyond |
| CRAN | |
| protViz | Foreach Parallel Adaptor for the ‘parallel’ Package |
References
1.
Kohler, D. et al. MSstats version 4.0: Statistical analyses of quantitative mass spectrometry-based proteomic experiments with chromatography-based quantification at scale. Journal of Proteome Research 22, 1466–1482 (2023).